
Spend Category Mapping Engagement
A structured review of your procurement ledger across suppliers, cost centres, and GL codes, producing a reconciled category map your finance and sourcing teams can act on.
Engagement detailsDaejeon · Est. 2016 · Procurement ledger analytics
We map category concentration, supplier dependencies, and tail-spend patterns from your AP exports — then deliver annotated charts your finance committee can read in one sitting.
Engagement preview
A structured review of your procurement ledger across suppliers, cost centres, and GL codes, producing a reconciled category map your finance and sourcing teams can act on.
Engagement details
Identify single-source dependencies and tail-spend fragmentation across your vendor base with ranked risk charts.
Engagement details
Recurring category snapshots for leadership meetings — updated charts and commentary each quarter.
Engagement details
Quantify low-value, high-volume transactions and outline consolidation options without disrupting critical suppliers.
Engagement detailsEvidence
Our deliverables are built for rooms where the CFO asks for the underlying supplier list before approving a consolidation sprint. Every chart ships with a reconciled table.
Read client storiesMRO · Packaging · Freight · IT services · Professional fees · Tail aggregate
Field notes

Category bars, Pareto curves, and supplier bubbles each answer a different question. Here is how we label them so your board can follow the argument.

Duplicate vendor records distort concentration metrics. These are the matching rules we apply before any chart is drawn.
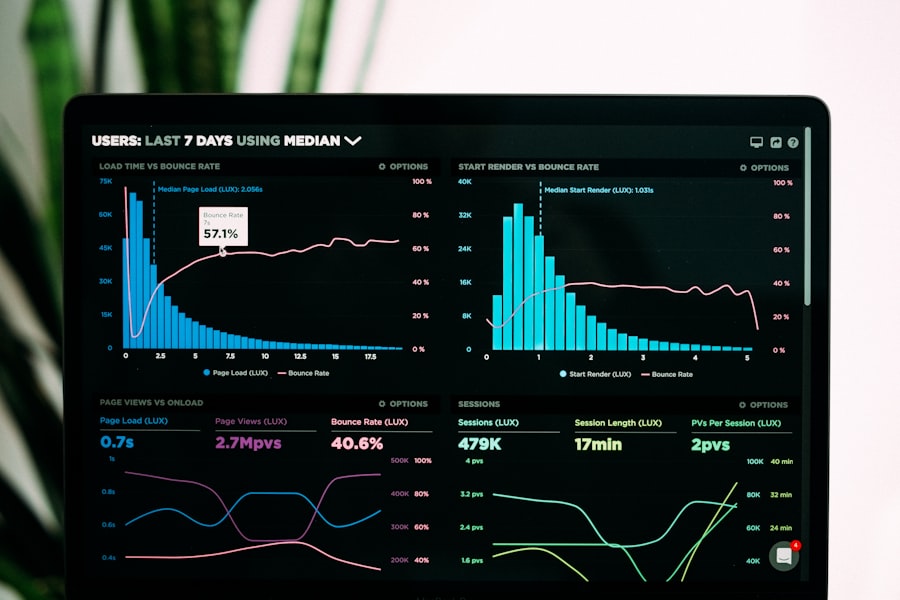
The 80/20 shape is familiar; the actionable cut point is not. We explain how we choose review thresholds for mid-market ledgers.
Share your ledger depth, plant count, and current category taxonomy. We respond within two business days with a draft scope and data checklist.
Request a Scope Call